Balazs Erdos
Exploring the insulin-mediated glucose homeostasis using a computational model
Balazs ErdosMaastricht Centre for Systems Biology (MaCSBio)
Type 2 diabetes mellitus (T2DM) is a heterogeneous disease characterized by deteriorations in the insulin mediated glucose homeostasis. Insulin resistance, a state of reduced insulin sensitivity may develop in tissues such as the muscle, liver and adipose tissue prohibiting sufficient insulin action and leading to increased stress on the pancreatic β-cells to produce more insulin. These deficiencies may later develop into T2DM. Lifestyle intervention may be effective in reducing T2DM incidence, however the early detection of deteriorations in the glucose-insulin system is difficult with current clinically used measures of the system. These single time-point and average measures following an oral glucose challenge test often fail to capture the dynamics in the longitudinal signal after a perturbation. A dynamic model may capture the important features in these response curves leading to a more detailed understanding of the glucose homeostasis. The model quantifies the rate of change of glucose and insulin in the processes highlighted in Fig 1.
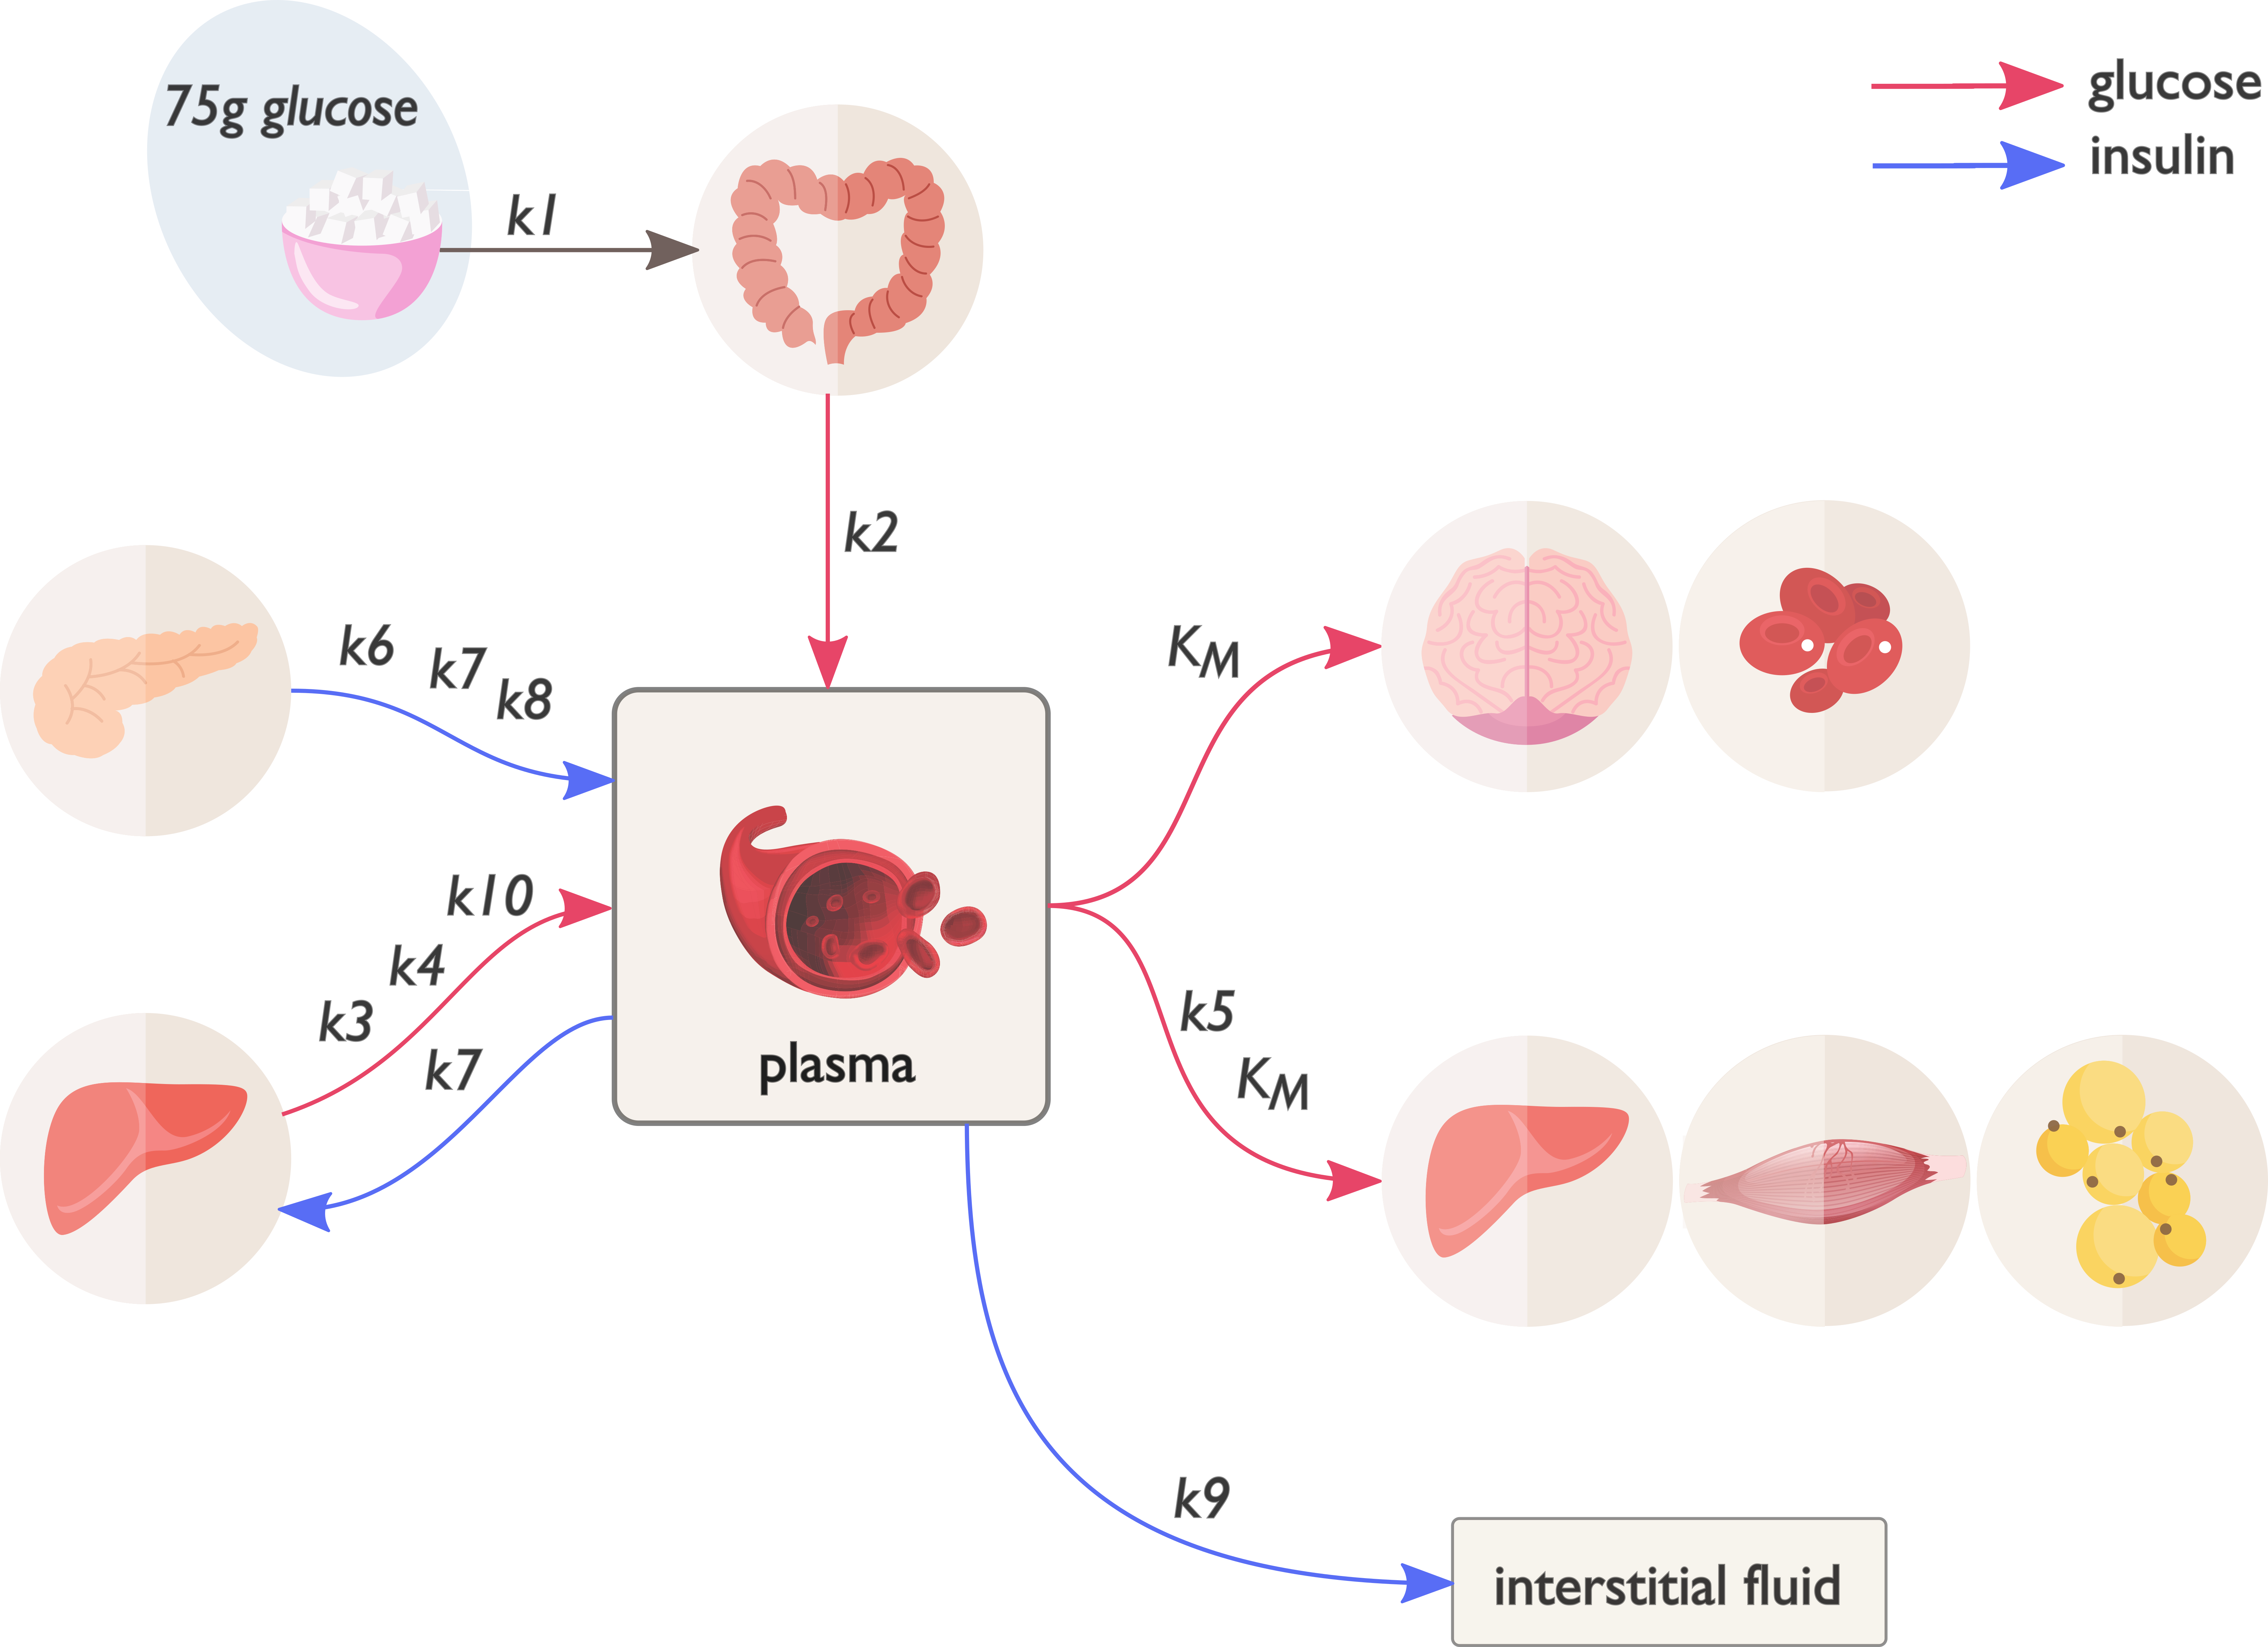
Fig.1 - Schematic of the eDES model, a dynamic model of the glucose-insulin system.
Following the ingestion of an oral glucose bolus glucose from the stomach is emptied into the gut (k1). The uptake of glucose from the gut to the plasma (k2) prompts the secretion of insulin from the pancreas into the plasma (k6, k7, k8) which in turn facilitates the disposal of glucose from the plasma to peripheral tissues (k5). Endogenous glucose production is suppressed during the fed state (k3, k4, k10), and a constant glucose uptake is assumed for the obligate glucose oxidizers (KM). Finally, insulin is cleared to the interstitial fluid (k9). Estimating a subset of the model parameters from individual challenge test data while fixing the rest to population averages allows us to explore potential differences in the glucose homeostasis of individuals (Fig 2).
Fig.2 - Parameter space of the model reduced to 2 dimensions with highlighted individual simulations.
The individual simulations are based on real challenge test data and depict features of the glucose homeostasis responses of individuals. Observe how the responses change as you move around in the parameter space of the model. The color of the responses in the figure represent an independent measure of insulin resistance, a particular feature of interest.
For details, please contact the author at balazs.erdos@maastrichtuniversity.nl
References
- Maas, A. H., Rozendaal, Y. J. W., van Pul, C., Hilbers, P. A. J., Cottaar, W. J., Haak, H. R., & van Riel, N. A. W. (2015). A Physiology-Based Model Describing Heterogeneity in Glucose Metabolism: The Core of the Eindhoven Diabetes Education Simulator (E-DES). Journal of Diabetes Science and Technology, 9(2), 282–292. https://doi.org/10.1177/1932296814562607
- American Diabetes Association. (2015). 2. Classification and Diagnosis of Diabetes. Diabetes Care, 38(Supplement_1), S8–S16. https://doi.org/10.2337/dc15-S005
- Tabák, A. G., Herder, C., Rathmann, W., Brunner, E. J., & Kivimäki, M. (2012). Prediabetes: A high-risk state for diabetes development. The Lancet, 379(9833), 2279–2290. https://doi.org/10.1016/S0140-6736(12)60283-9